
Add a Power BI report into a Power Page
In this article we will discuss how to add a Power BI report into a Power Page section.
Scenario:
- Our company has a Power Page site.
- Internal Management already log into his site view various performance and forecasting information.
- They also want to view an analysis of current and historical sales history. This information needs to be Live.
- We have already created a Power BI report that displays the information required. This report is available through a Power BI Workspace in our Production environment.
nternal Management already log into his site view various performance and forecasting information.
Preparation
- We have created a Power Page site.
- We have created a Power BI report and saved it an accessible Power BI Workspace
Configure Power Pages to access Power BI
The first step is to enable your Power Page site to connect with Power BI.
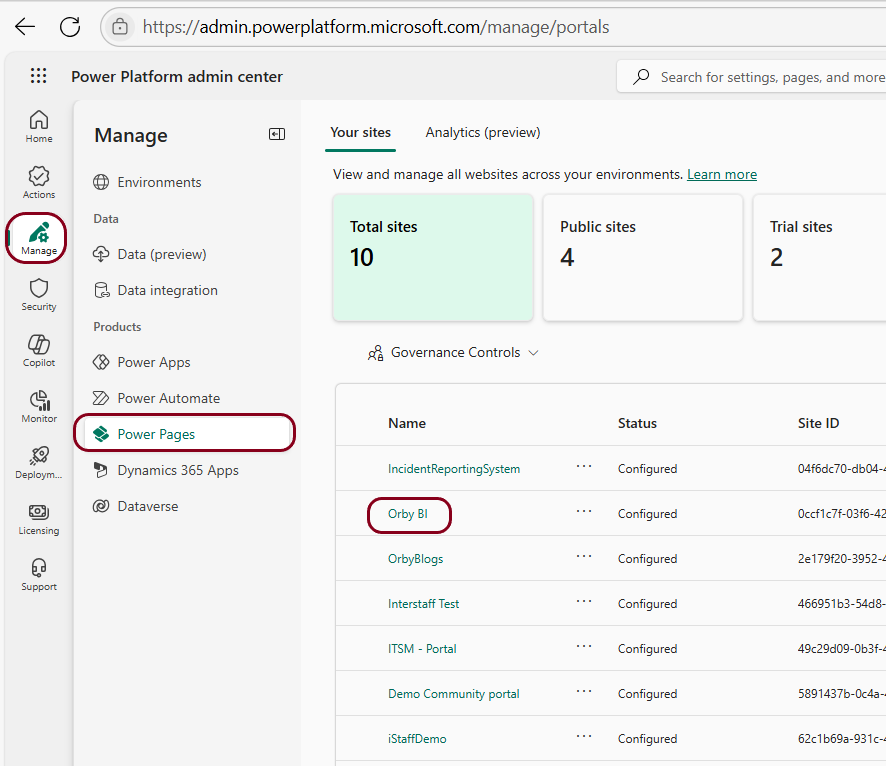
- Open the Power Platform Administrator (New admin centre experience)
- Click on Manage then Power Pages then select the Site you will work with.
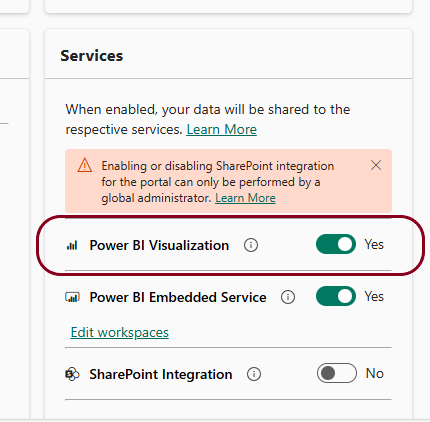
- In the bottom right hand corner, enable Power BI Visualization
Configure Power Page Site
Open the Site in Power Pages Design studio.
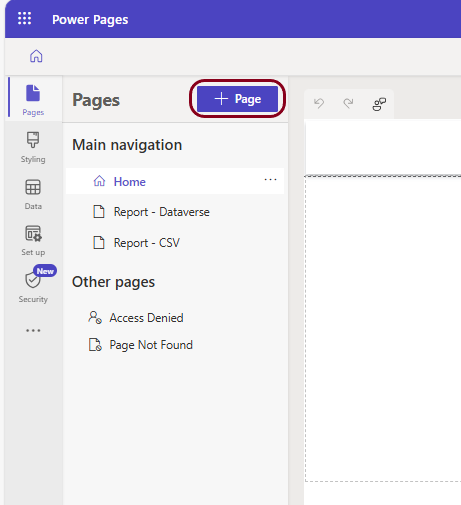
The report will be displayed in it’s own page, so we need to create a Power Page for this purpose.
From Main Navigation, click on [ + Page ] to add a new Page.
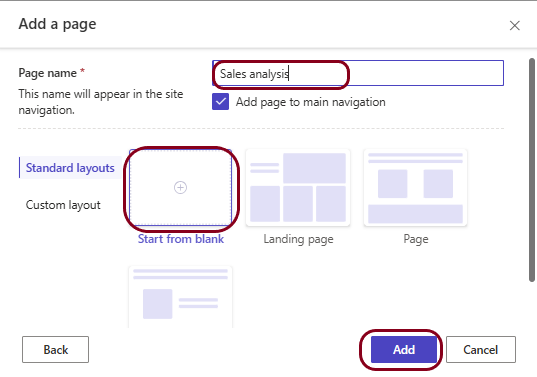
Give the new page a meaningful name.
For this example we want to add the report into a blank page, but you can select from any of the options to create a new page.
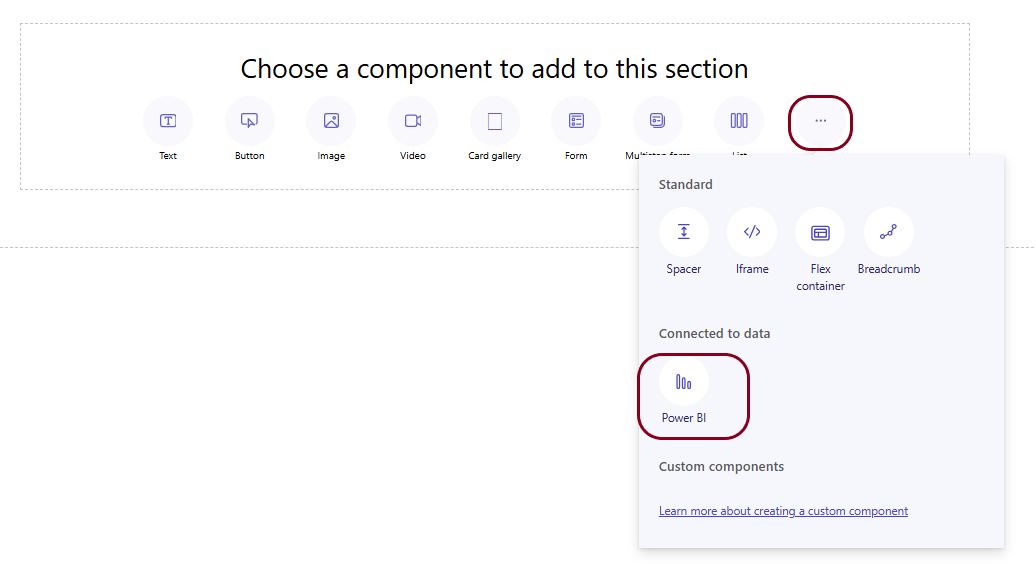
By default, a blank section will be added to the new page. From Choose a component to add to this selection, click on … and select Power BI
Now we need to configure the Power BI object we want to display. Click inside the Power BI section and the Edit Power BI button will be displayed in the top left hand corner of the section. Click on this button.
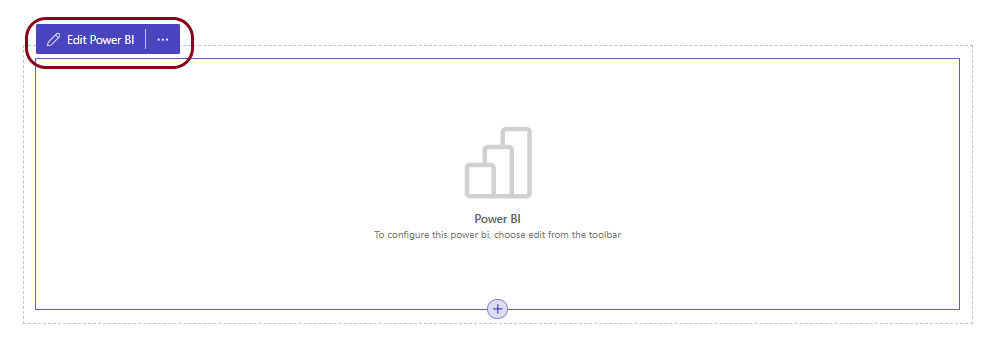
The Power BI configuration dialog will load.
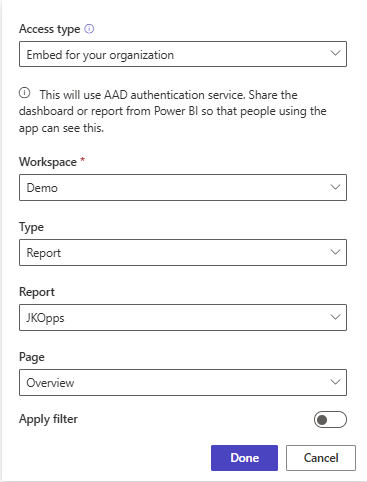
| Setting | Comments |
| Access type | |
| Workspace | |
| Type | Report or Dashboard – we will select Report for this example. |
| Report | Select from the dropdown that will list Reports/Dashboards in the selected Workspace |
| Page | The page in the Report you want to open when the page opens. |
Click on [ Done ] when you have finished.
The report won’t be displayed in the Design studio. To view report, click on Preview then Desktop.
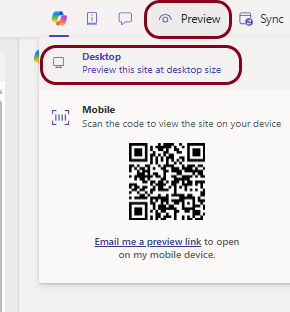
The user may be asked to login to Microsoft again.
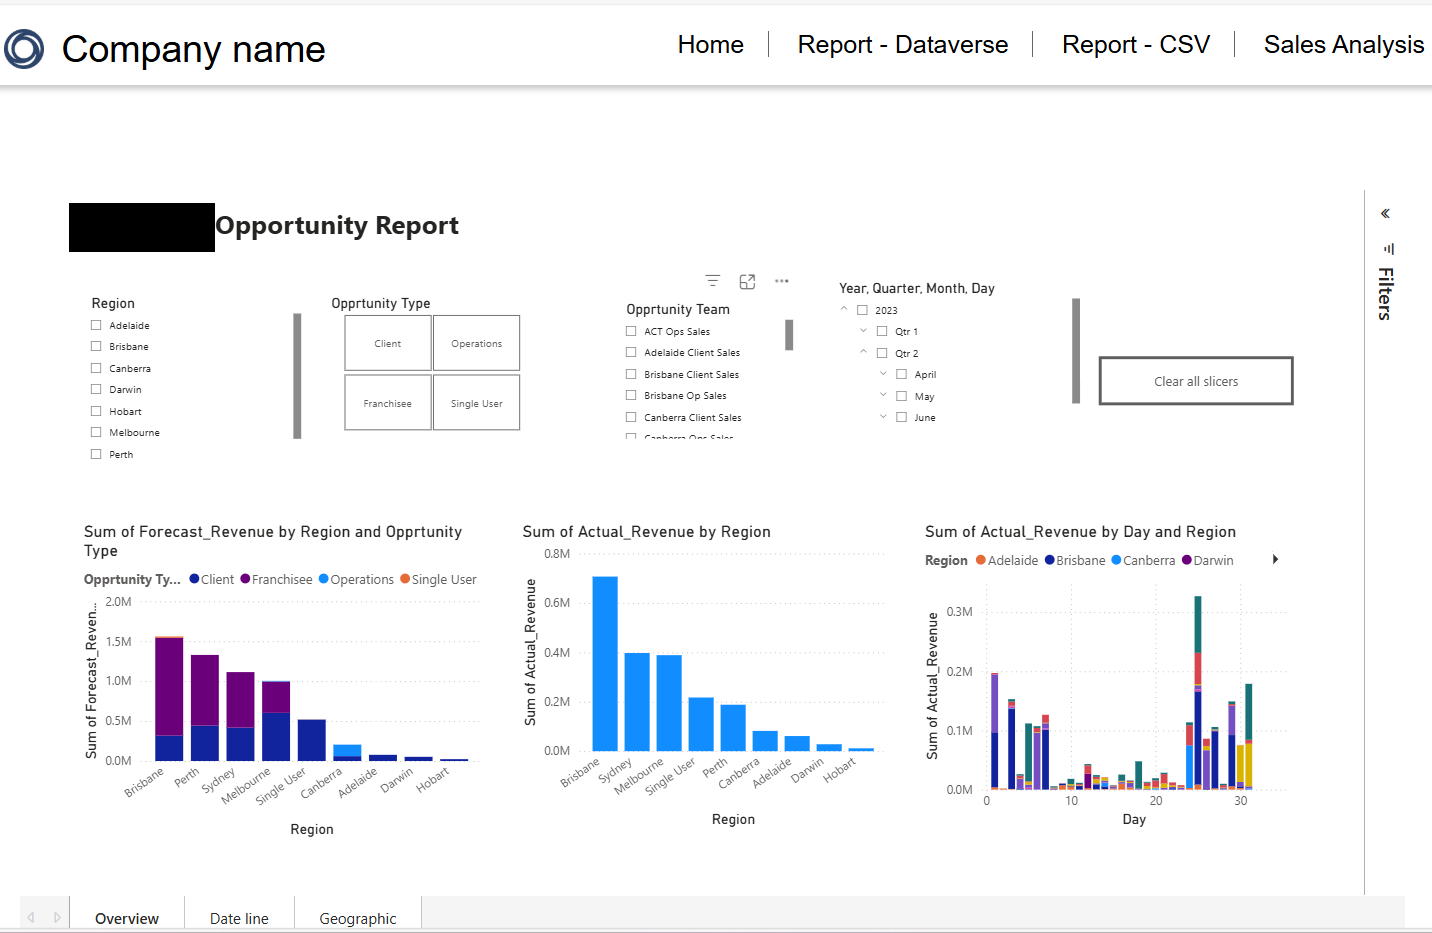
The report will be displayed.
Requirements
| Requirement | Detail |
| Power BI License | Power BI Premium Capacity (or Premium Per User) |
| Report Location | Report must be in a Power BI workspace with Premium |
| Identity | Users must sign in via Azure AD (configured as an identity provider) |
| Report Permissions | Users must have at least Viewer access to the report in Power BI |
| Supported Data Access | Direct Query, Import, Live Connection all work (depending on report design) |